The Queen Creek General Plan provides a decision-making framework for choices regarding land use, transportation, parks and open space, law enforcement, fire, and other services and physical improvements that will shape the Town and impact residents’ quality of life. Arizona State Law requires that every jurisdiction in Arizona with more than 2,500 residents have a General Plan, update it every 10 years and in large jurisdictions, or rapidly growing jurisdictions such as Queen Creek, voters must also ratify, or approve, the General Plan at a general election. On May 15, 2018, voters approved the 2018 General Plan.
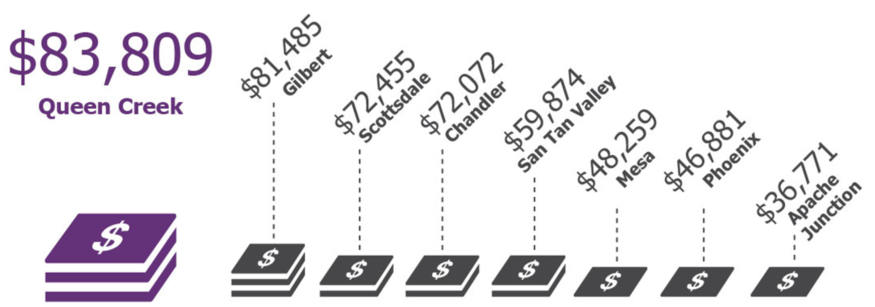
Queen Creek is a highly desirable place to live in Arizona. A family friendly community, the Town has the highest percent of population under 20 years old in the East Valley. (ACS 2010-14, 5-year est.) We have a slightly higher percentage of college graduates than the neighboring communities of Gilbert and Chandler (ACS 2010-14, 5-year est.), which are home to several high-tech employers. Queen Creek has the second highest median household income in Maricopa County, and the highest housing values in the East Valley (Eliot & Pollack). Queen Creek has a lower labor force participation rate than Chandler and Gilbert (2010 US Census). Almost all of Queen Creek’s working residents work outside of Town (US Census Bureau, OnTheMap Application and LEHD Origin Destination-Employment Statistics-2014), and residents have longer commutes than many other Maricopa County residents.
Research tells us that individuals born after 1980 are more adventurous, and want the convenience of living close to the things they need, the things they do, and the people they do them with. Instead of driving, they prefer to walk around the corner to the neighborhood coffee shop and restaurant. They own fewer cars. In the future, if current trends continue, Queen Creek will have more single family homes and places to shop. It will have few places where people who can afford to live in the community can work, and few places where people who grew up in Queen Creek can live when they become young adults. Development around Phoenix-Mesa Gateway airport is anticipated to include warehousing and distribution employment, which generally does not provide the high wage jobs necessary to afford new housing in Queen Creek. As surrounding areas like San Tan Valley and Superstition Vistas continue to develop, there will be increased traffic on our roadways; Queen Creek residents will continue to have longer commute times than the average Maricopa County resident. Even with new roadway improvements, population growth in and around Queen Creek will add traffic on our roads. The General Plan update is an opportunity to change or keep these trends.
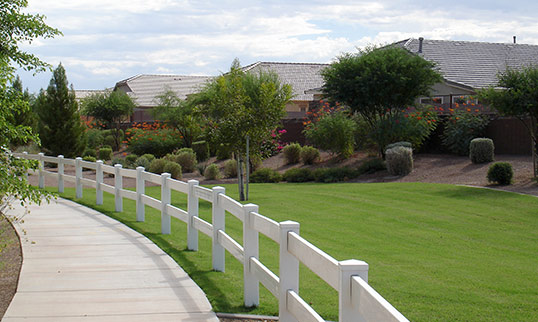
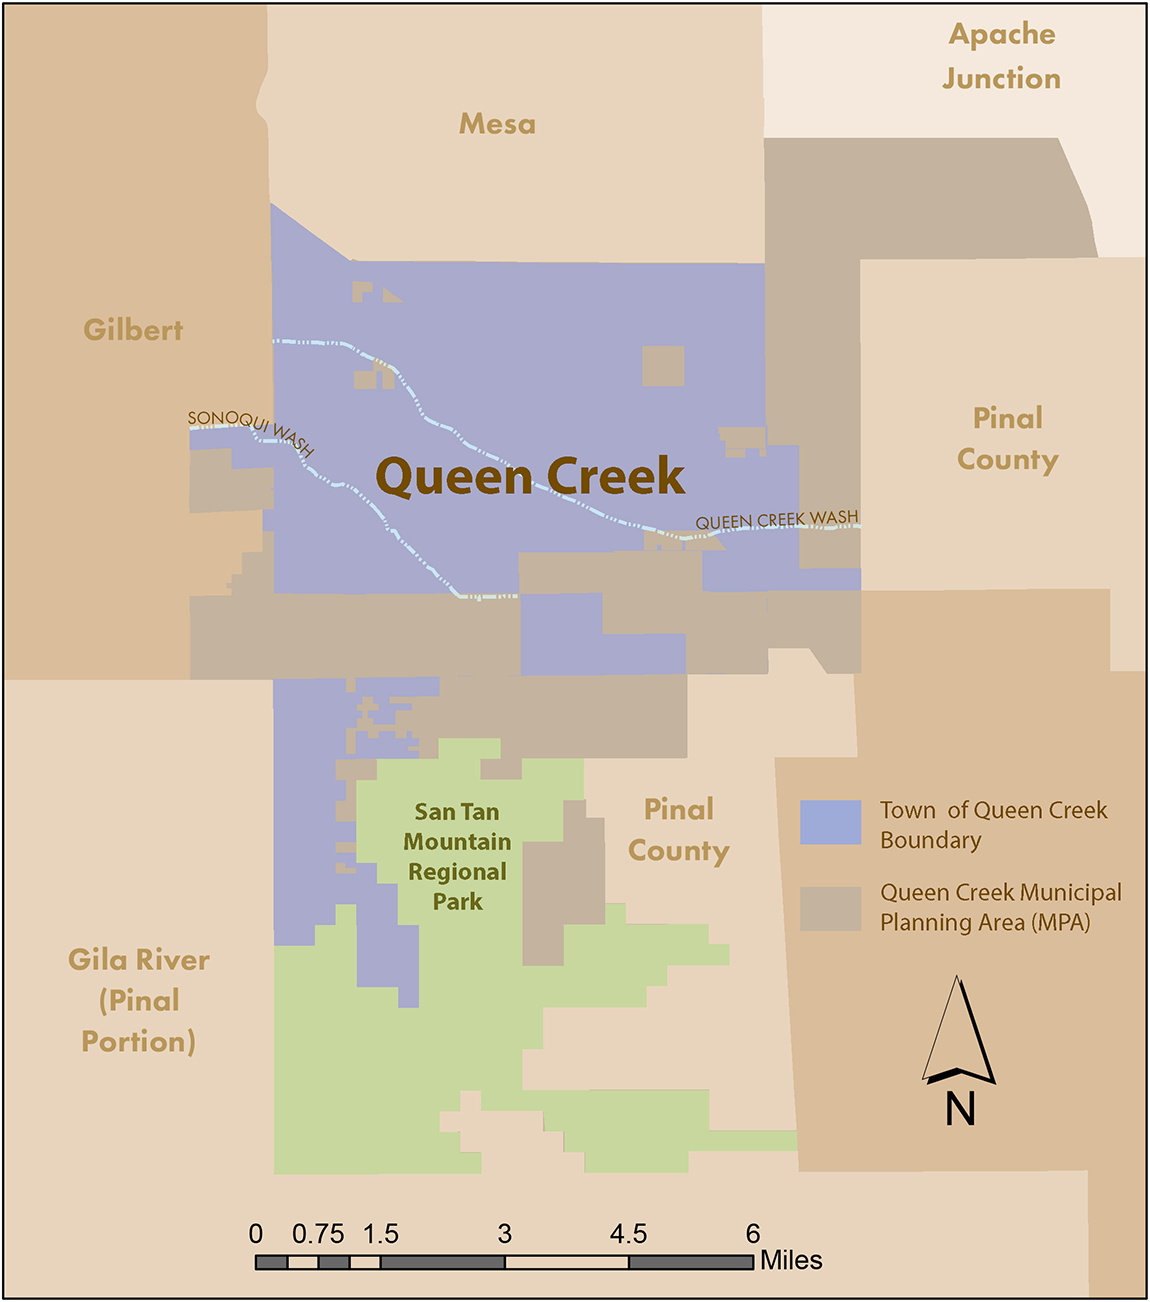
A sustainable community balances the needs of providing a high quality of life for current residents with the needs of future residents. The Town offers a variety of natural resources including the Queen Creek and Sonoqui washes, and access to the San Tan Mountain Regional Park. Residents enjoy quality water, wildlife, agricultural areas and open skies. The Town strives to grow strategically and sustainably, maintaining the quality aspects that make Queen Creek a wonderful place to live, play and learn.

The Planning and Zoning Commission (P&Z) served as the steering committee for the 2018 General Plan, and helped with the development of the plan. The Planning and Zoning Commission recommended the 2018 Town of Queen Creek General Plan to the Town Council for ratification at its September 13, 2017 meeting.
Watch Meetings View Meeting Agendas Meetings were held on the following dates:Planning & Zoning Commission General Plan Public Hearings
August 9, 2017 at 7:00 p.m. September 13, 2017 (Queen Creek Community Chambers at 20727 E. Civic Parkway)Town Council General Plan Public Hearings
August 16, 2017 at 5:30 p.m. September 20, 2017 at 5:30 p.m. (Queen Creek Community Chambers at 20727 E. Civic Parkway)Community Design Workshop
Feb. 16, 2017, 5:00-8:00 p.m.Planning Commission Line-by-Line Review
July 12, 2017, 6:00 p.m.The Town Council was briefed on the General Plan update periodically throughout the planning process.
View Meeting AgendasTown Council Update:
August 16, 2017 at 5:30 p.m.Town Council Public Hearing and consideration of the General Plan for adoption
September 20, 2017 at 5:30 p.m. (Queen Creek Community Chambers at 20727 E. Civic Parkway)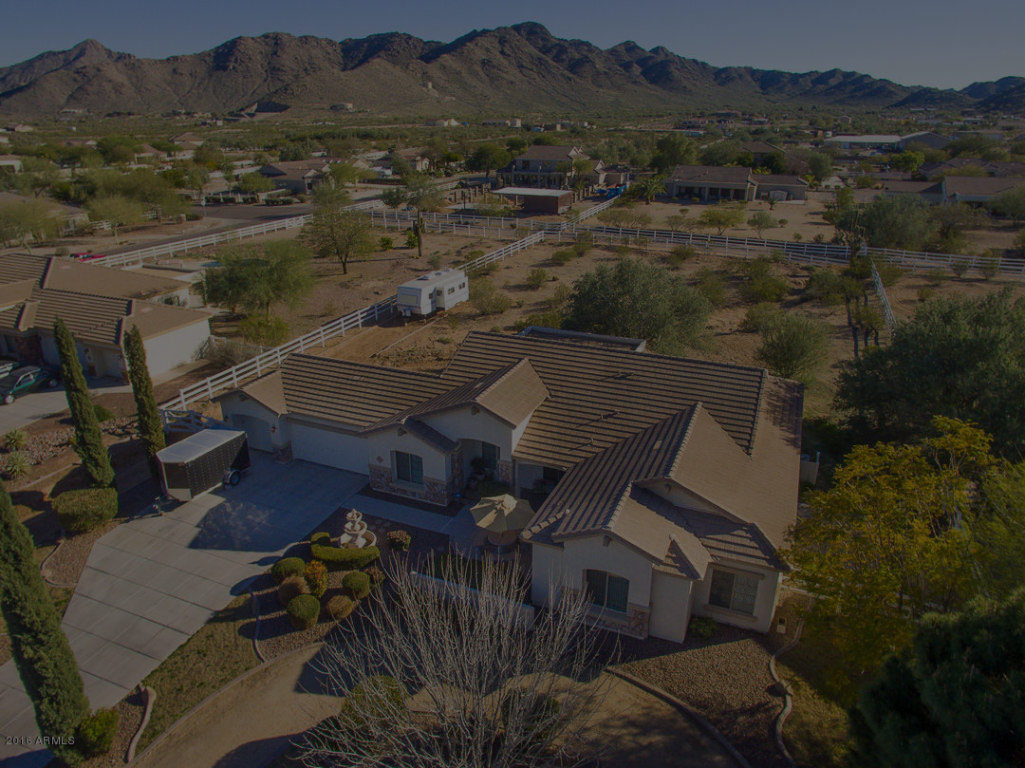
Your Opinion Is Important!We received input from a broad range of people participating in this General Plan update. Your input helps ensure Queen Creek is a great place to live and raise a family. Continue to stay involved by following us on Facebook and Twitter.
Queen Creek Demographic Report
ACS 2010-2014 5-year est.;
MAG 2015 Demographic viewer-Accessed 10/12/16
MAG July 1,2015 Population Update;
Town of Queen Creek, 2017
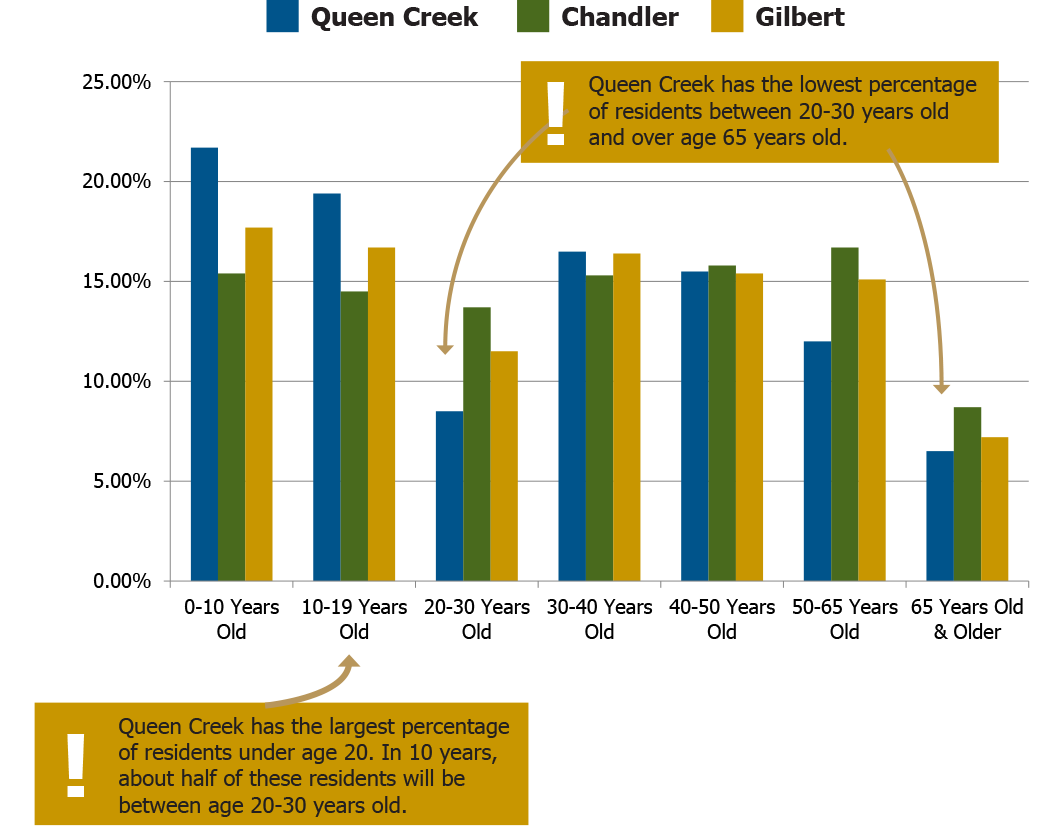
Queen Creek is a fast growing, young community. Families with children make up 84% of the population. More than a third (41%) of Queen Creek’s population is age 19 or under as compared to Gilbert (34%) or Chandler (30%).
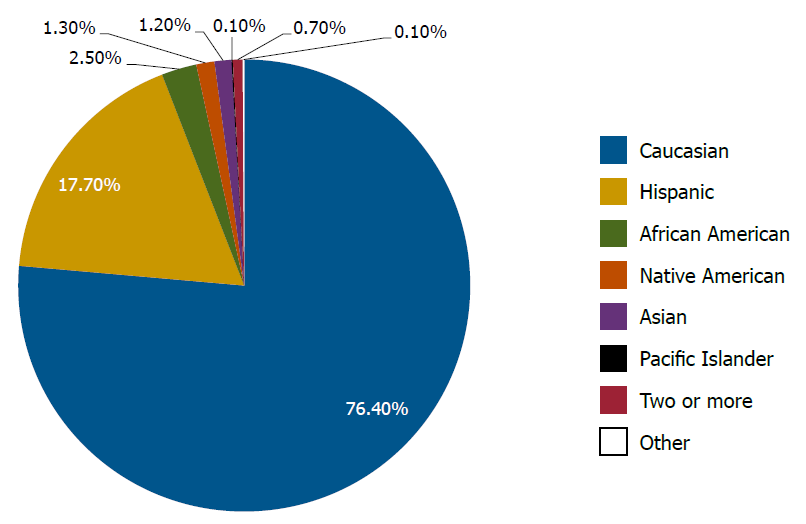
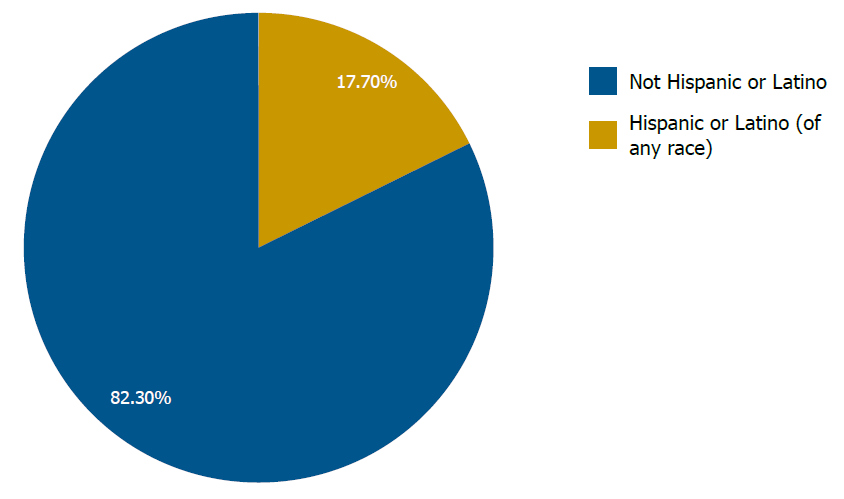
Minority population represent approximately 23% of the population. These groups include African American, Native American, Asian, and Pacific Islanders.
 Source: 2010-2014 ACS Survey (5-year estimates); DP05-ACS Demographic & Housing Estimates
 Source: 2010-2014 ACS Survey (5-year estimates); DP05-ACS Demographic & Housing Estimates
College graduates earn about 73% more than high school graduates, and those with advanced degrees earn 2-3 times more. People with higher education are less likely to be unemployed or live in poverty. Communities enjoy the benefits of an educated population due to the higher earnings of educated workers which generate higher local, state, and federal revenues, and a reduced dependence on public income-transfer programs.
 ACS 2010-2014 5-year estimates
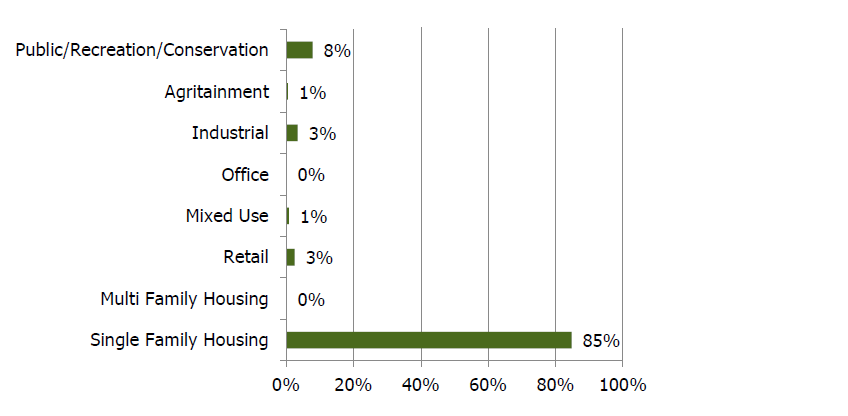
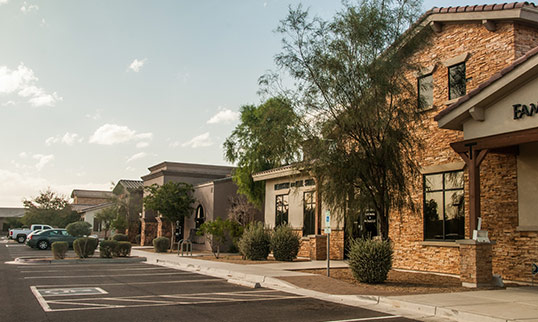
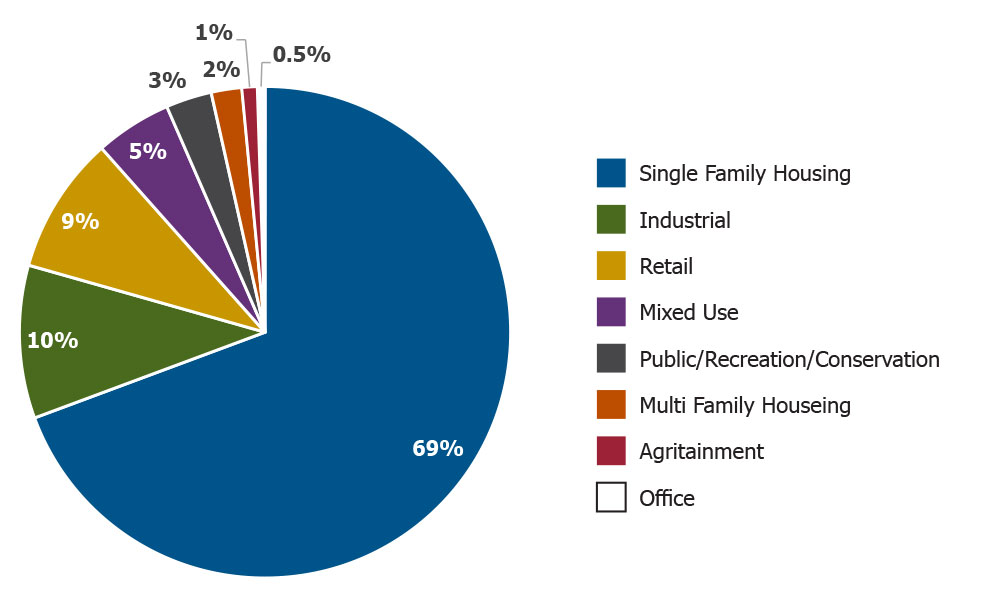
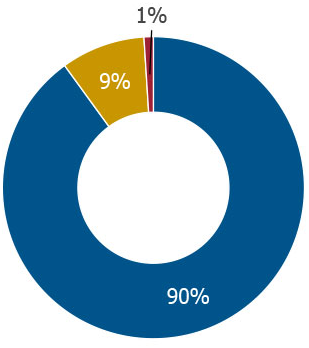
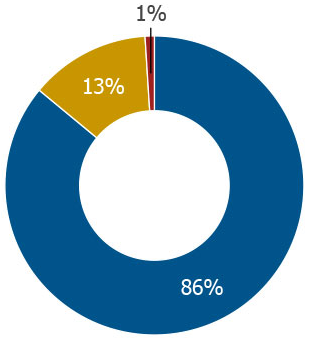
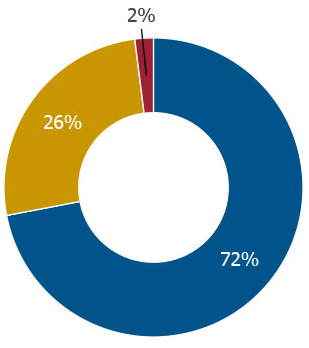
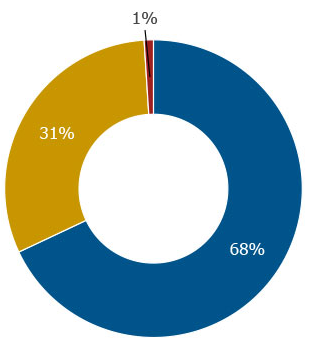
Currently, 85% of the developed land is single family housing. Public open space is the next largest category. Less than 1% of the developed land includes apartments, condominiums, and other places where young adults and empty-nesters would typically live. Less than 1% of the land is developed with professional offices; and less than 3% is developed industrial types of uses.
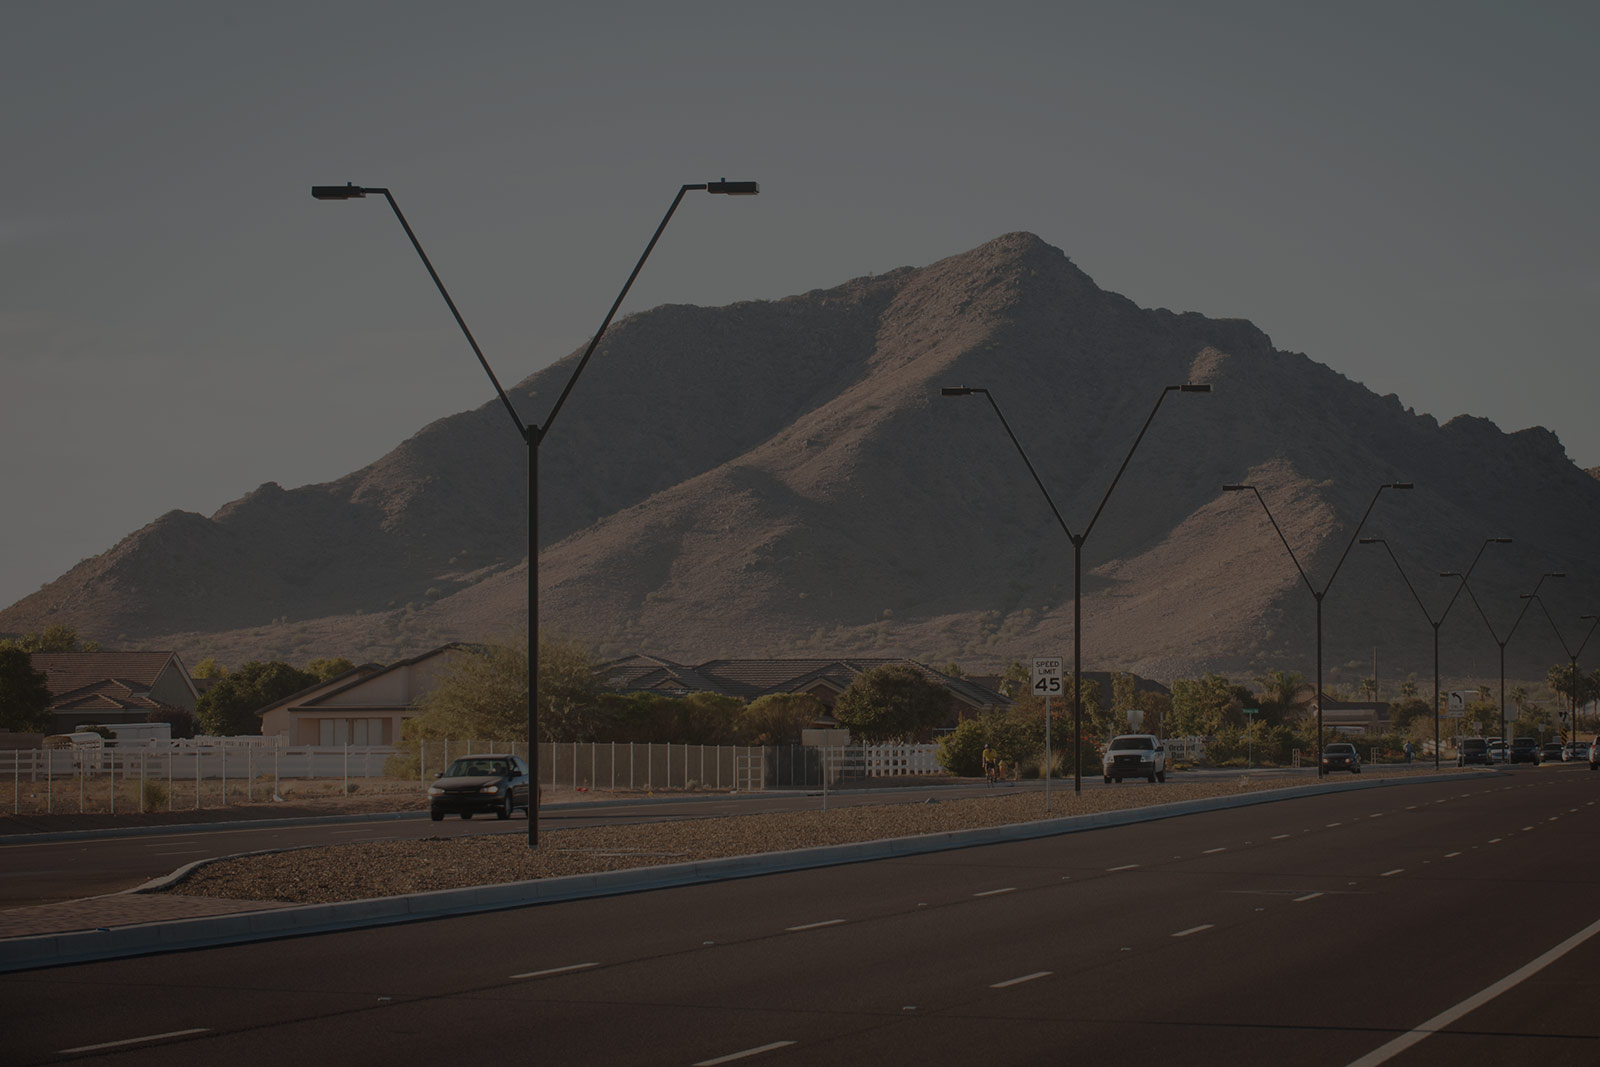
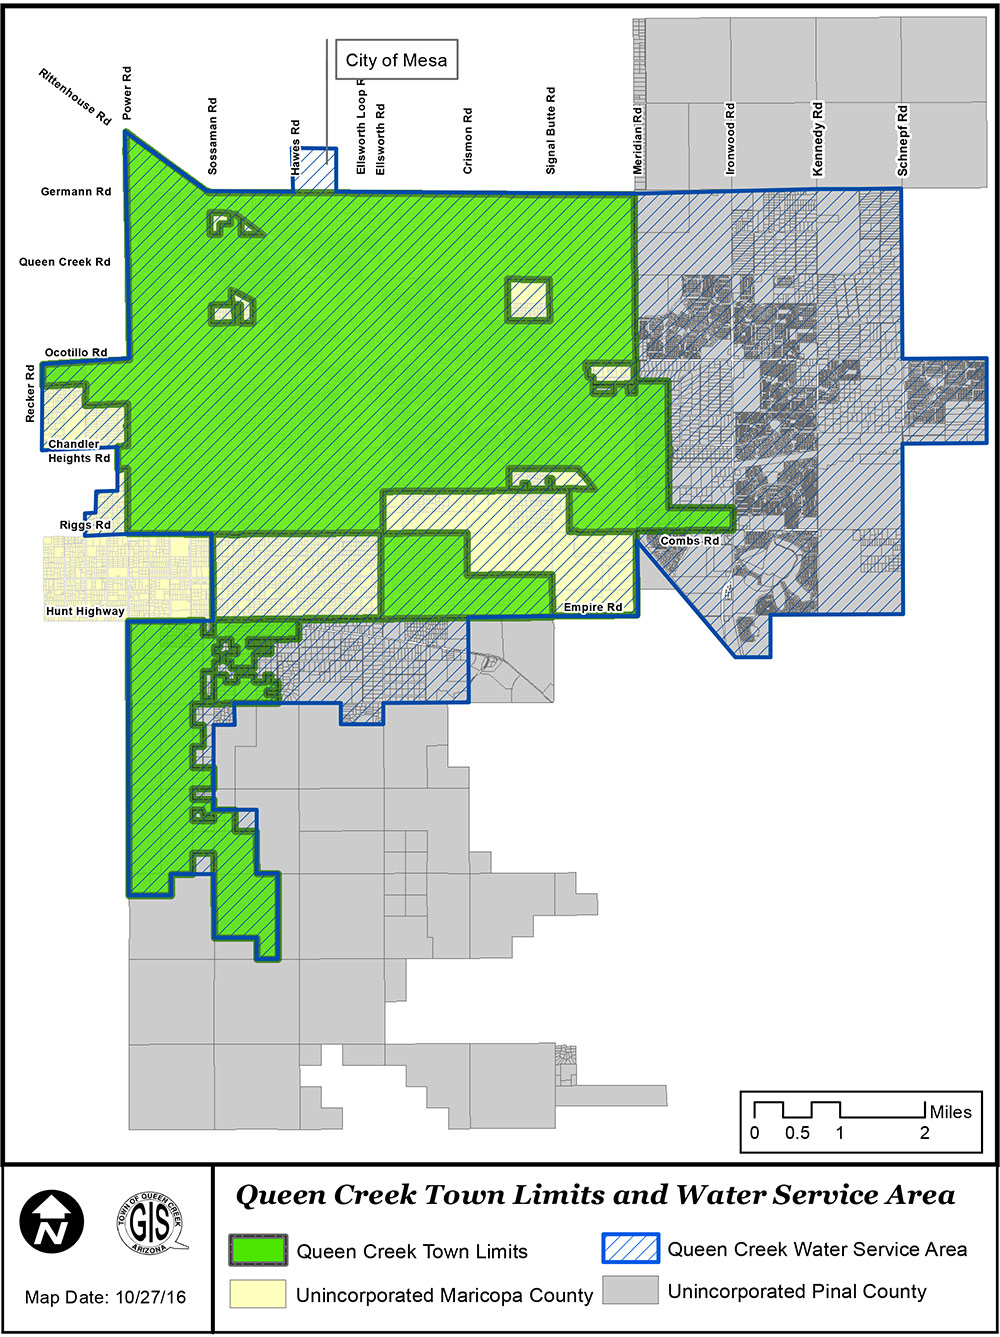
Queen Creek is bordered by Gilbert to the west, Mesa to the north, the San Tan Mountains to the south, and Pinal County and San Tan Valley to the southeast. Queen Creek and Sonoqui washes cross the Town from the northwest to the southeast. Phoenix-Mesa Gateway Airport borders the community to the north. The Town is mostly flat, and is situated at the base of the San Tan Mountains.
Since the Town was incorporated in 1989, the Maricopa County Sheriff’s Office (MCSO) has been providing law enforcement services for Queen Creek through multi-year contracts. MCSO District 6, the substation located in, and dedicated to the Town of Queen Creek receives approximately 25,000 calls for service annually.
The 2015 Public Safety Audit recommended continuing contract services with MCSO based on the Town’s current population. As the community continues to grow, the need for a municipal police department should be reevaluated. The current contract provides a local substation with over 40 dedicated sworn, law enforcement personnel. It also includes access to a variety of resources including K-9s, SWAT, the helicopter and many other investigative and support services if needed (source CPSM LE Master Plan for final info).
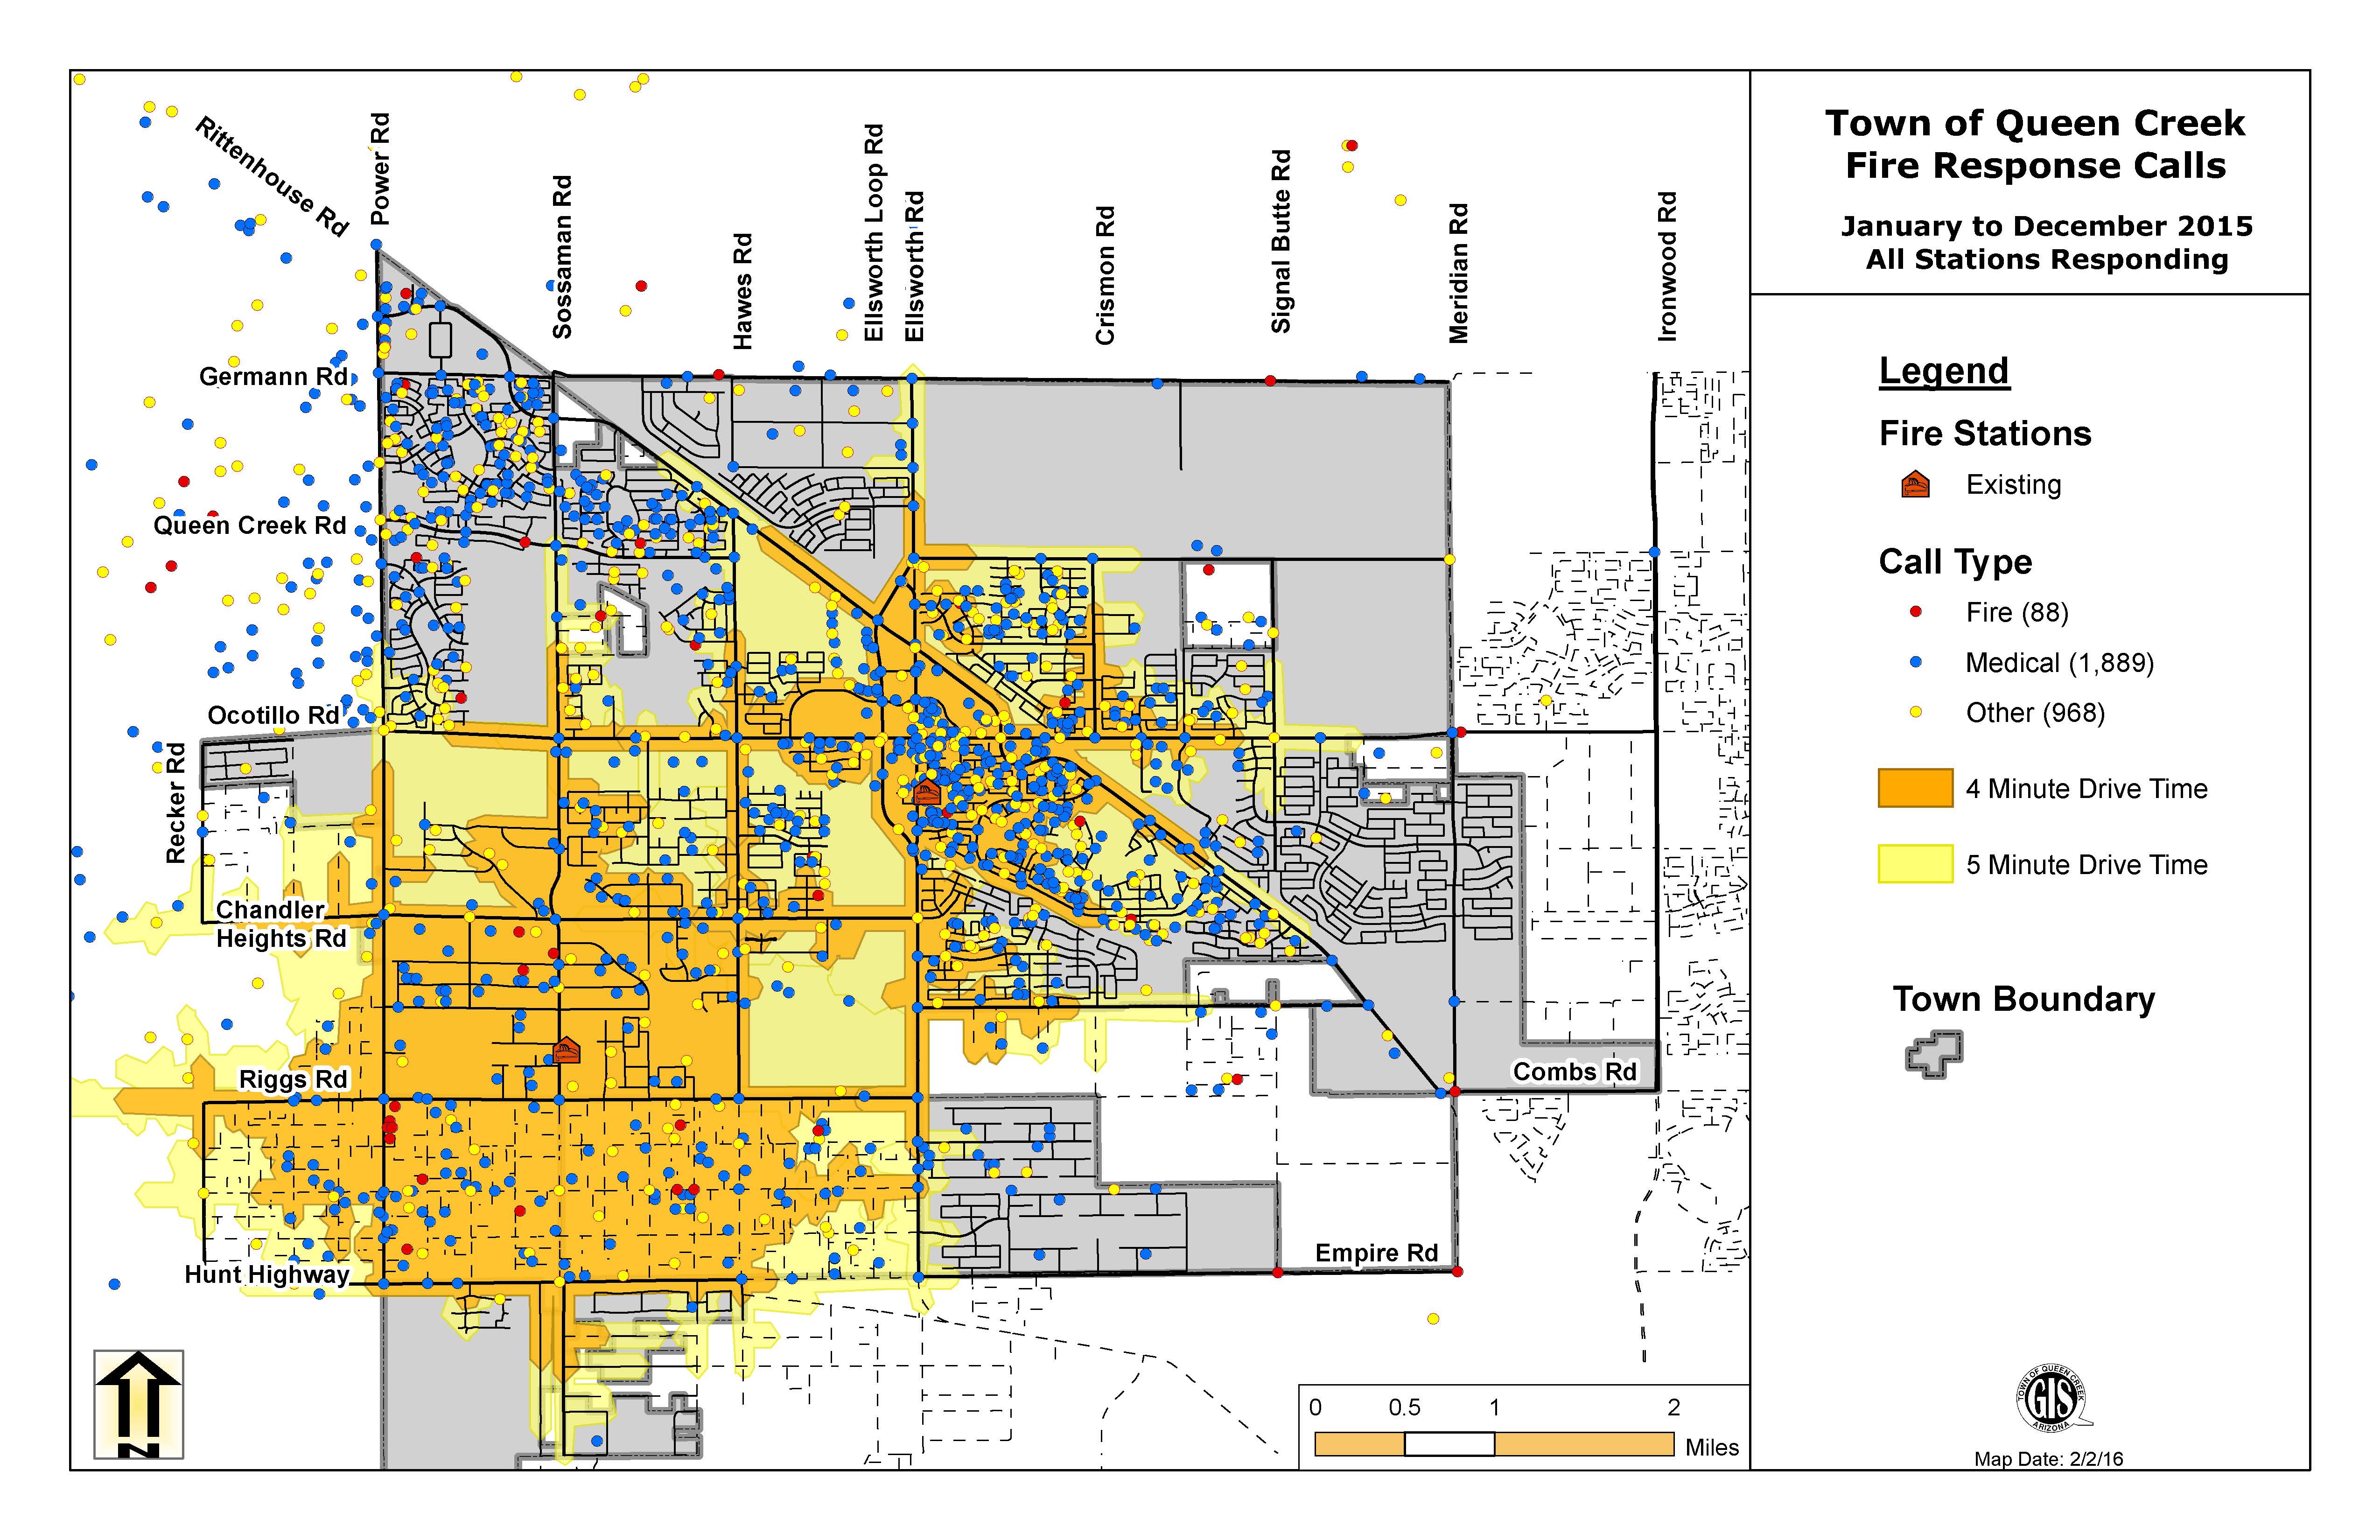
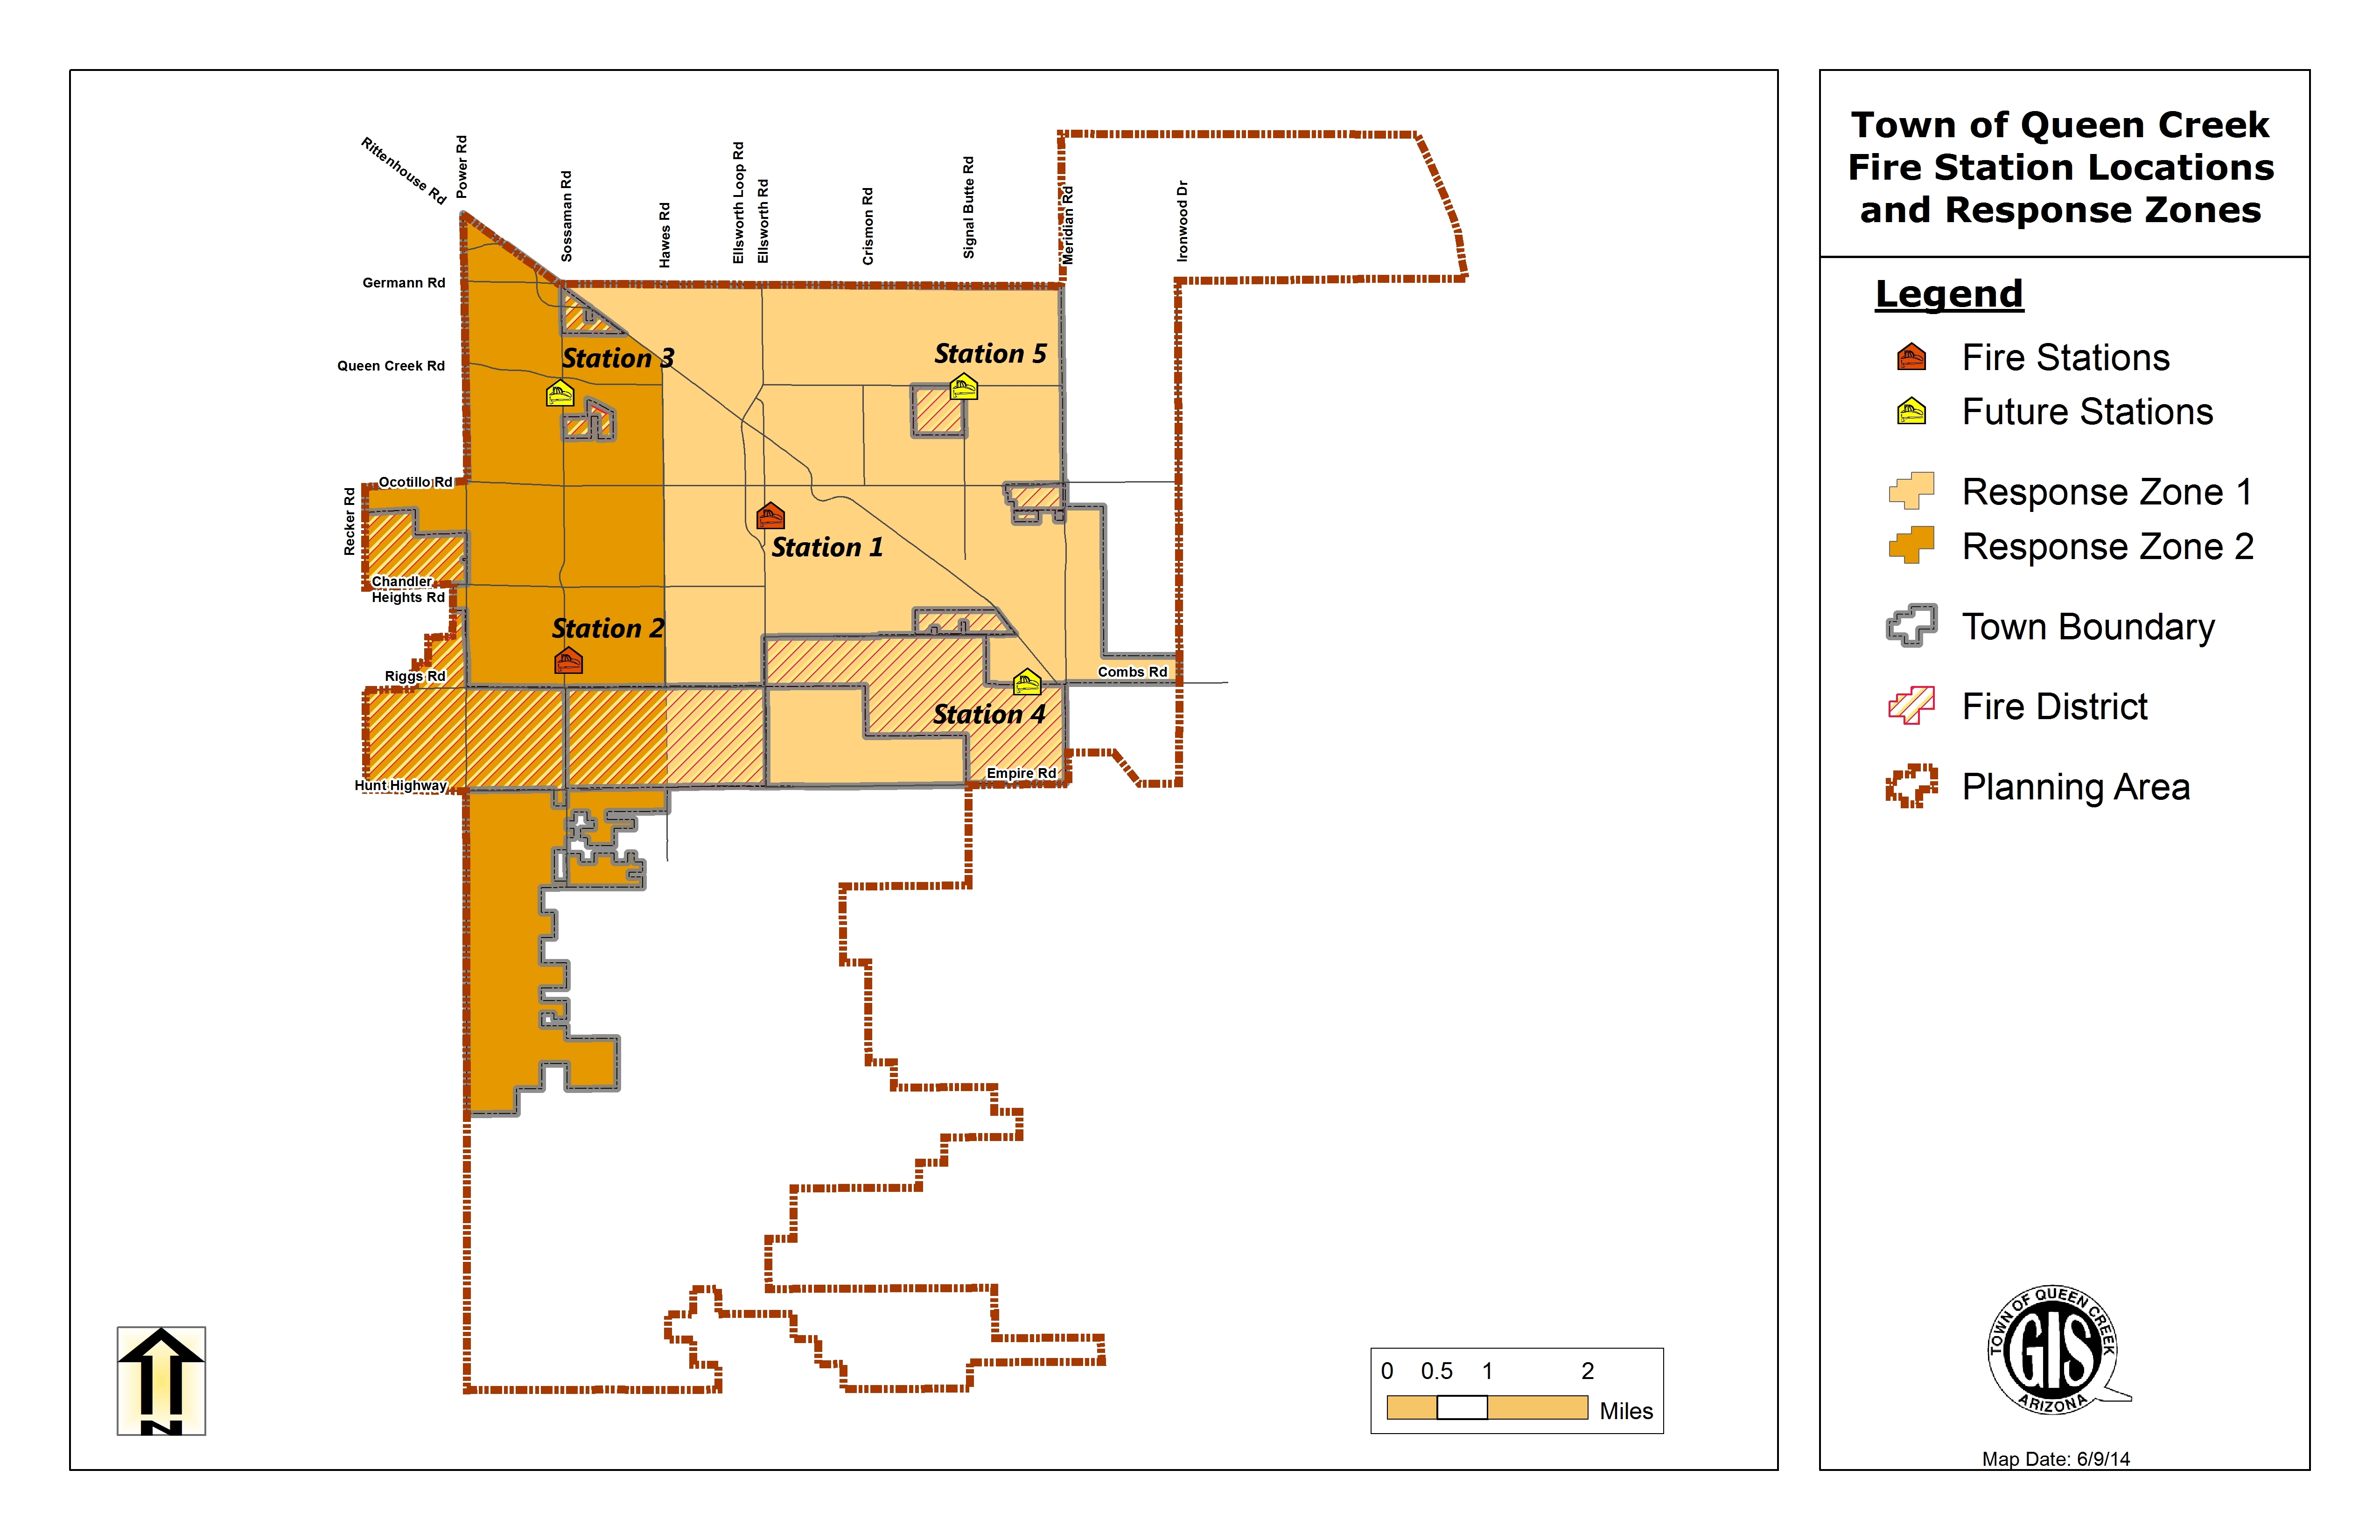
Construction of a permanent public safety building is currently under construction in Town Center. The need was originally identified in the 2004 Municipal Center Plan, and prioritized in the 2013 update. The Town currently has two fire stations, one located in the Town Center and the other in the southwest portion of Town. A large majority of the Town can be reached by the Fire Department in 4-5 minutes during an emergency, however, some areas are located outside of that 4-5-minute window. To better serve these areas, 3 future fire station locations have been identified: one in the northwest potion of Town (currently under construction), one in the northeast portion of Town, and one in the southeast portion of Town. A permanent, replacement station is also under construction in Town Center.
QCFMD is part of the Automatic Aide System, which is a partnership amongst the East Valley Fire Departments. The Automatic Aide System allows the closest available engine to respond, regardless of jurisdictional boundaries. As a result, engines from Gilbert, Mesa and Superstition periodically respond to calls. In 2015, QCFMD responded to 2,945 calls for service.
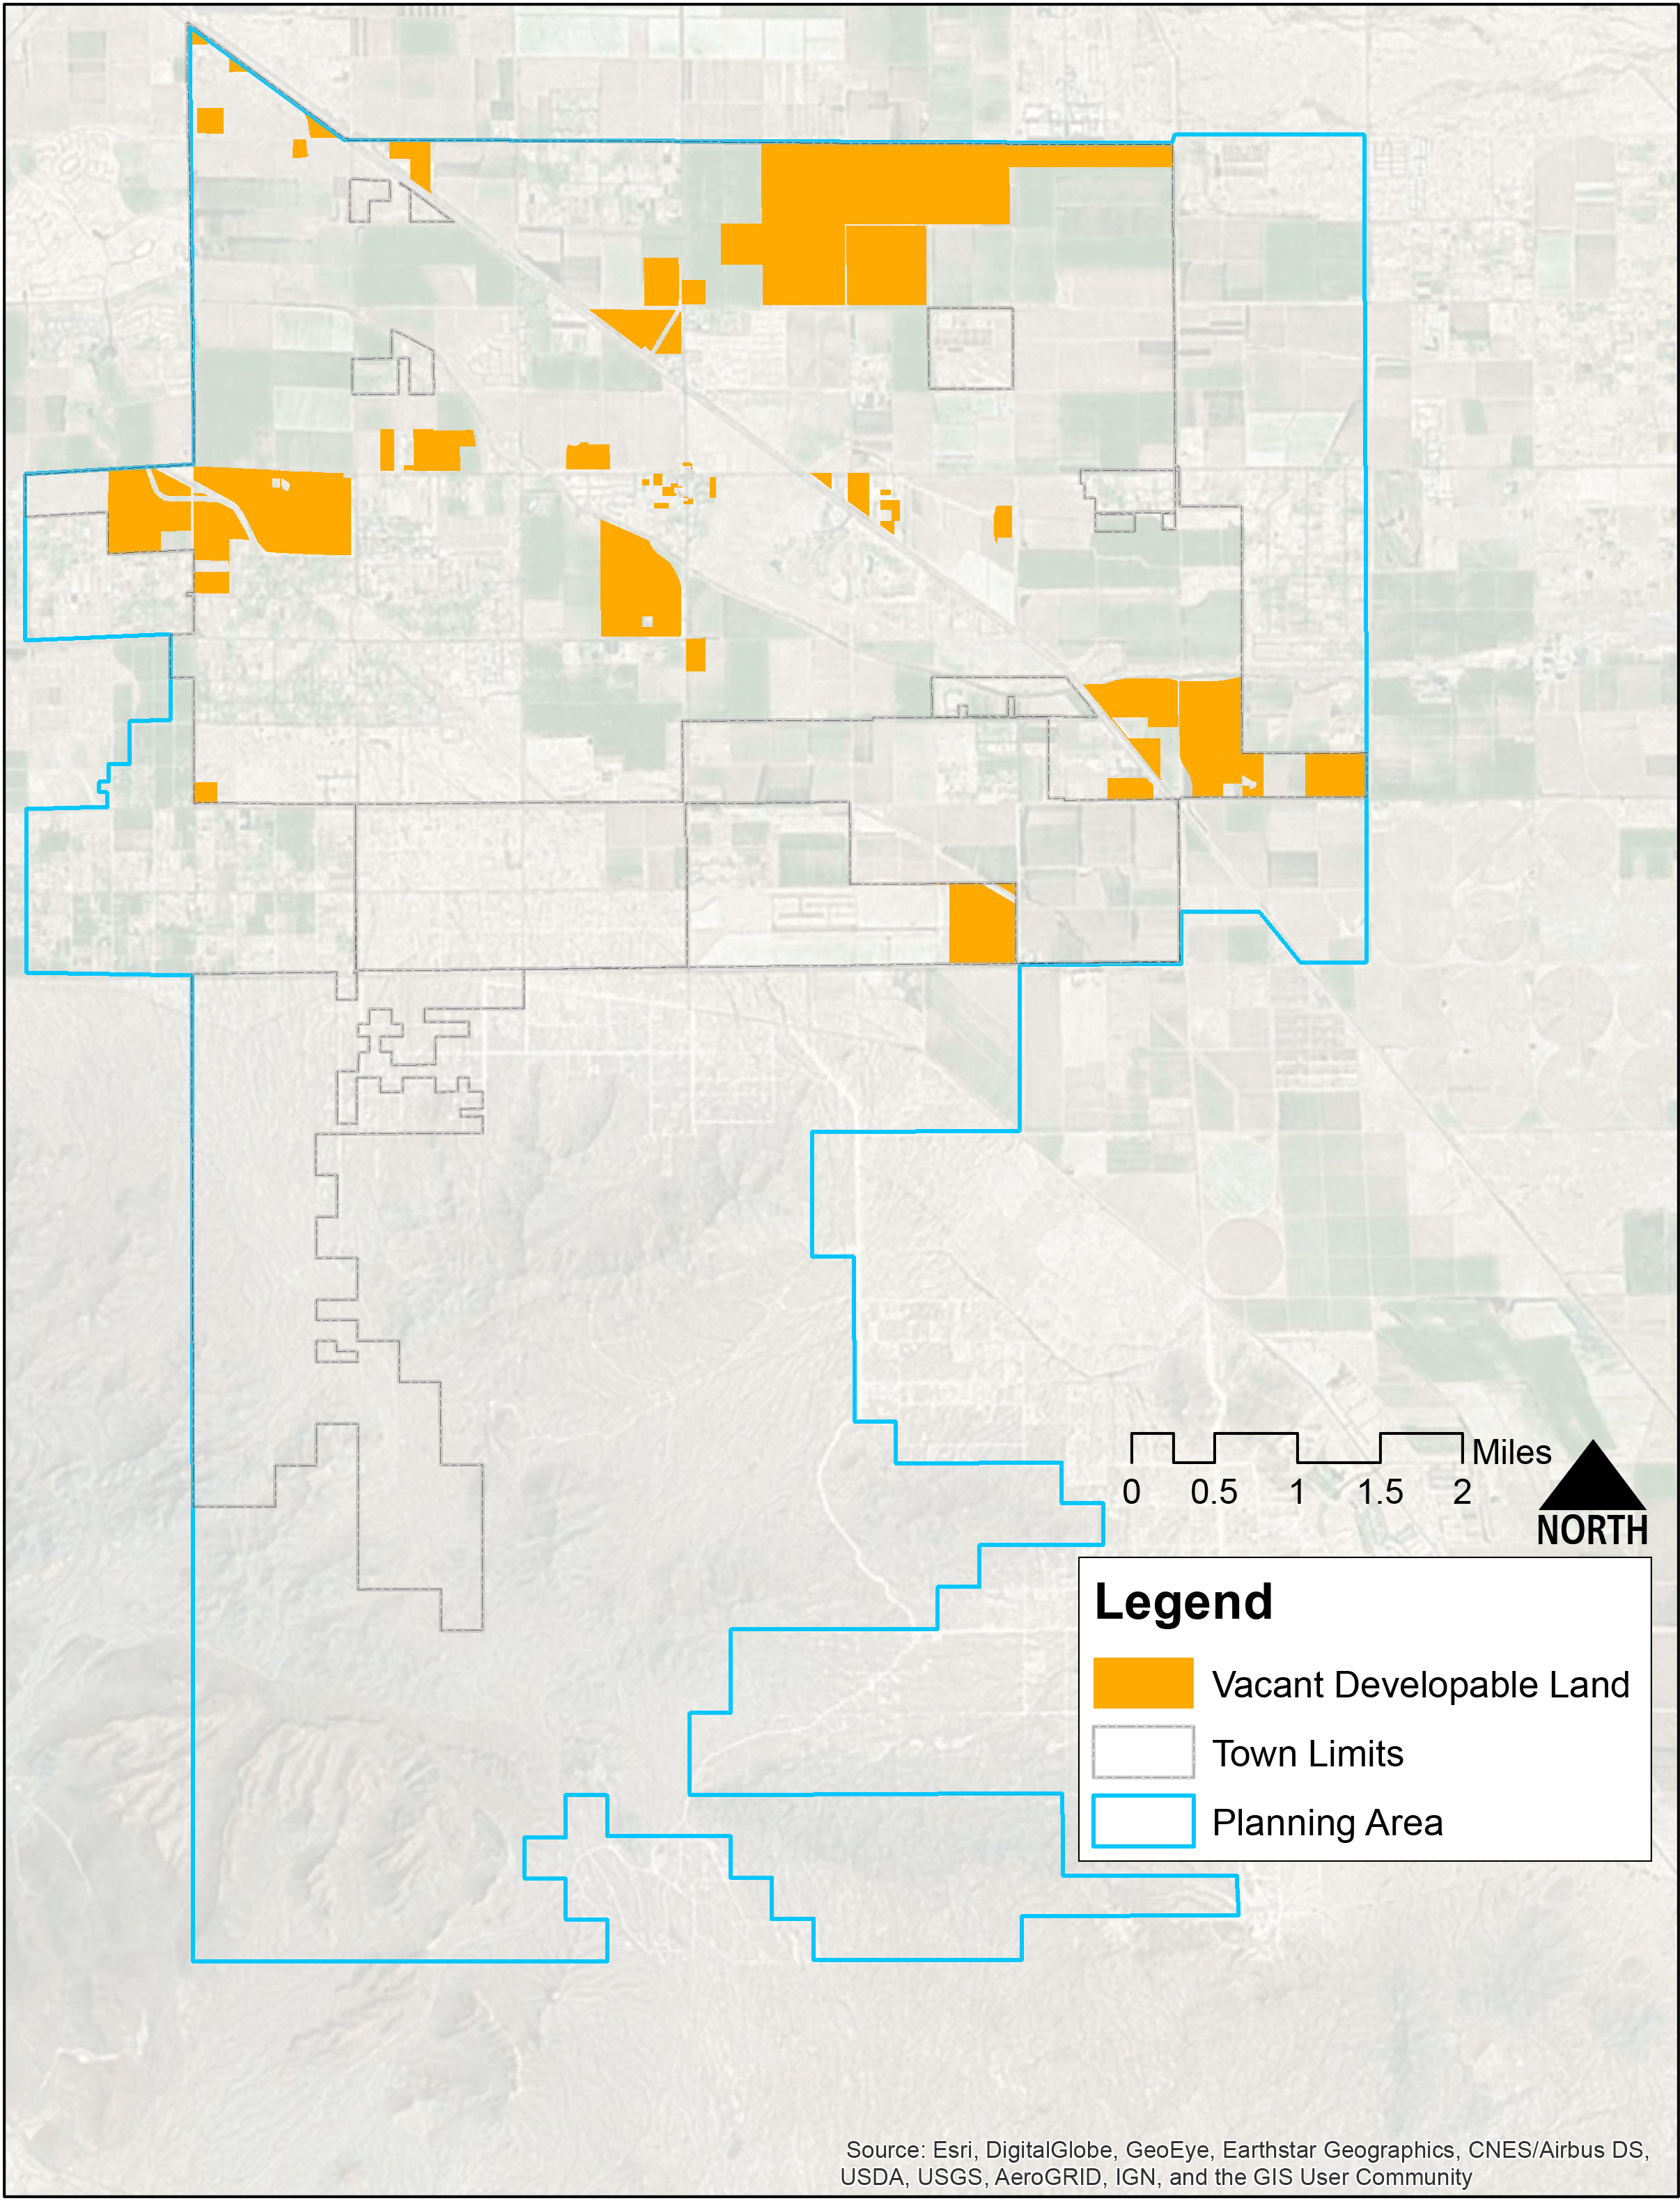
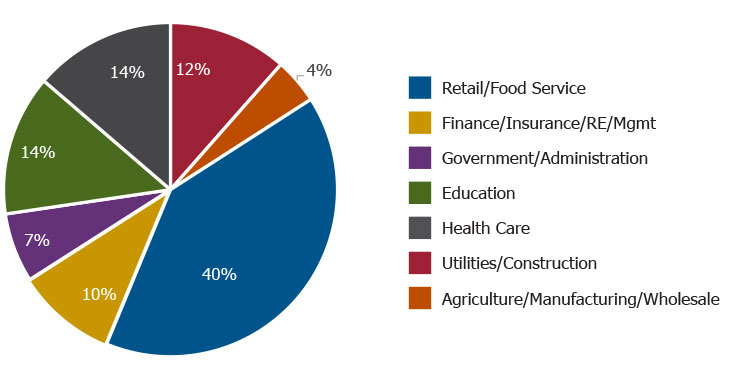
Queen Creek’s vacant land is where residents can set a course for new development. The current General Plan, which guides land use, sets a course for the Town to be a single-family bedroom community with limited areas for apartments, condominiums, and mixed-use communities desired by young adults and empty-nesters.
This chart shows the planned General Plan Land Use for vacant land in the Town’s planning areas, which includes areas that are planned to be incorporated into Queen Creek in the future.

 Elliott D. Pollack and Co.
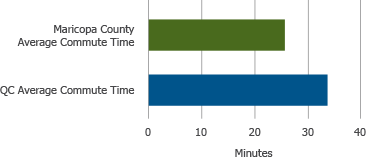
The average commute time for QC residents is eight minutes longer than the average commute time for residents in all of Maricopa County.
A large portion of residents who live in Queen Creek commute to other communities for work, and many people who work in Queen Creek commute from other communities. According to the U.S. Census origin destination data, Queen Creek has a workforce of 11,752 people, of which 11,123, or nearly 95 percent out commute to jobs in other cities. At the same time, there are 4,408 people who commute into Queen Creek to work, while 629 both live and work in Queen Creek.This inflow and outflow of the workforce is depicted below. The arrows represent inflow and outflow of workers from other cities throughout the Valley.
Source: US Census Bureau, OnTheMap Application and LEHD Origin-Destination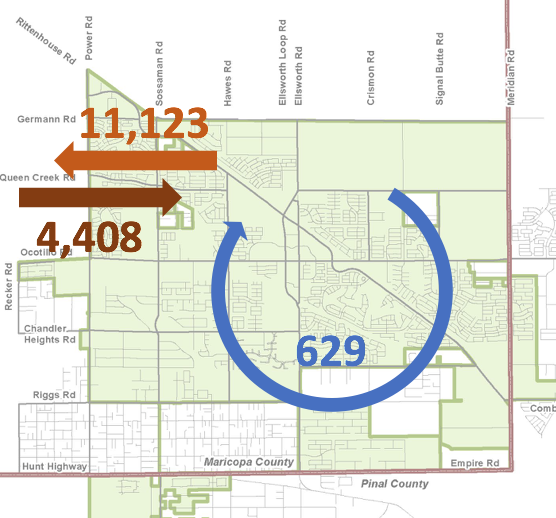
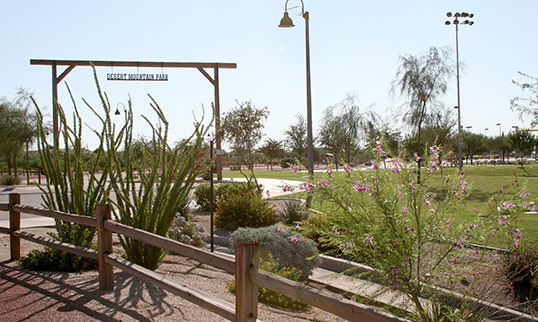
Queen Creek offers an extensive multi-use trail system, beautiful parks and great recreation programs, making Queen Creek a wonderful place to live, play and learn. Residents are enjoying the amenities that Queen Creek has to offer; nearly one-third of residents visit a park at least once a week.
Queen Creek updated the Parks and Recreation Master Plan, which was incorporated into the General Plan Update. To learn more about the Parks and Recreation Master Plan Update, visit QueenCreek.org/PlanQCParks.
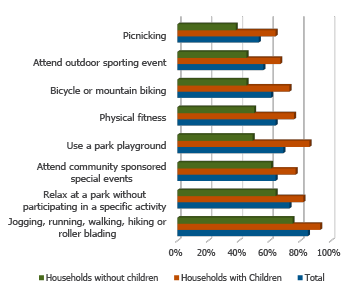
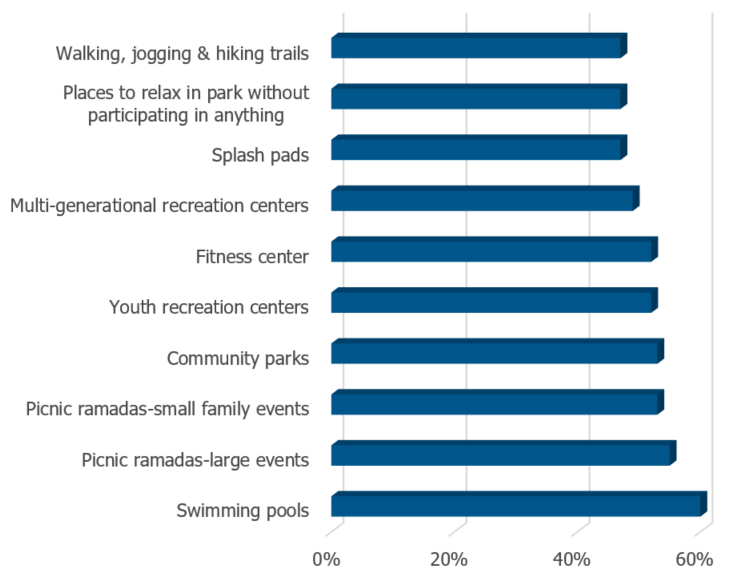
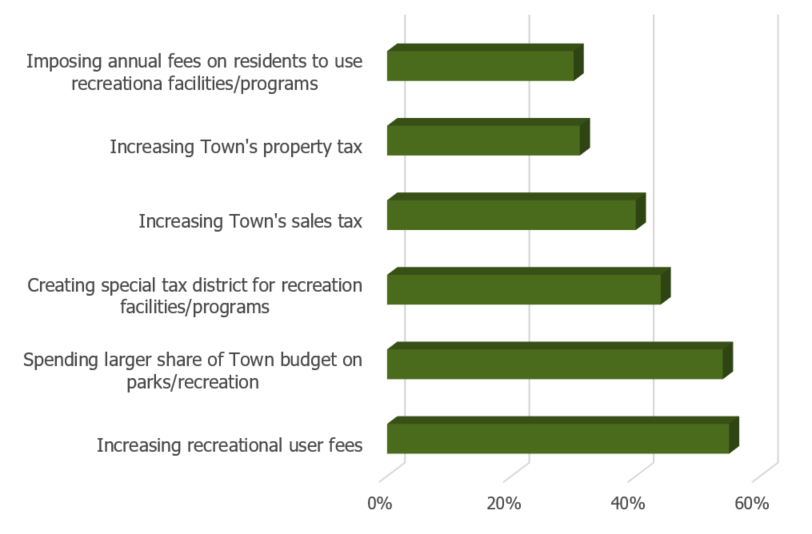 July 2016 Town of Queen Creek Parks & Recreation Survey | Survey Links
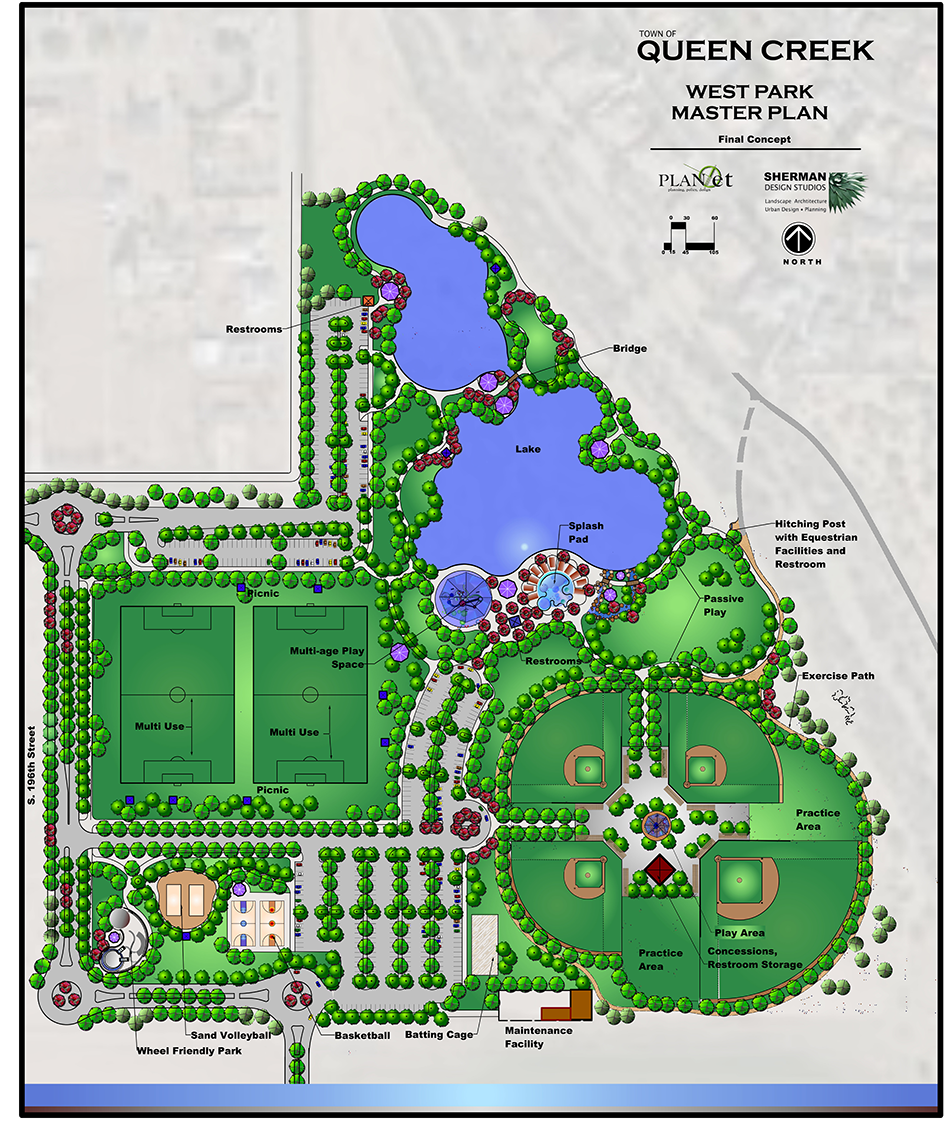
In November 2016, the Town Council approved a conceptual design plan for the 30-acre West Park site, located at 196th Street and Appleby Road. The park will include ballfields, soccer fields, a splash pad, wheel park, lake, and picnic and play areas. The park is planned to open in the fall of 2018.
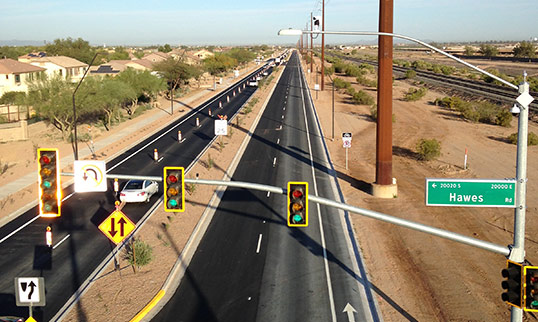
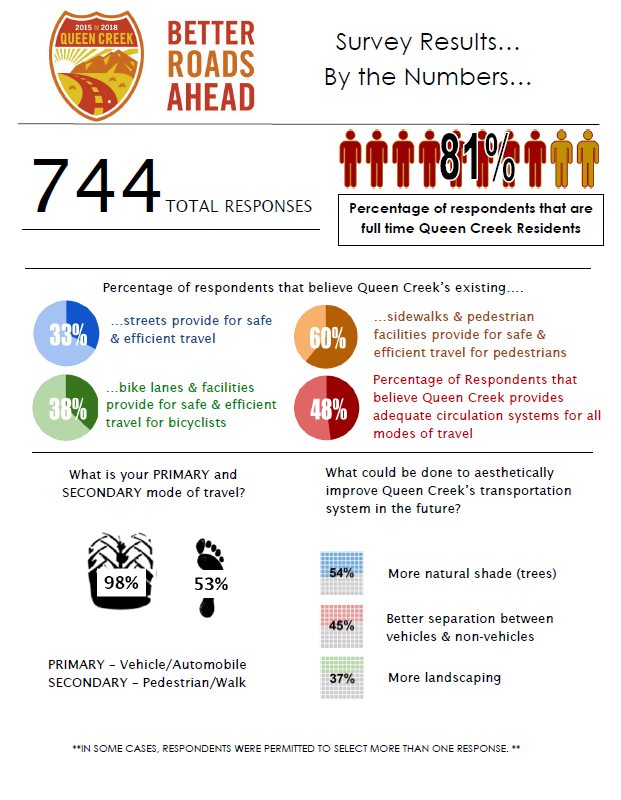
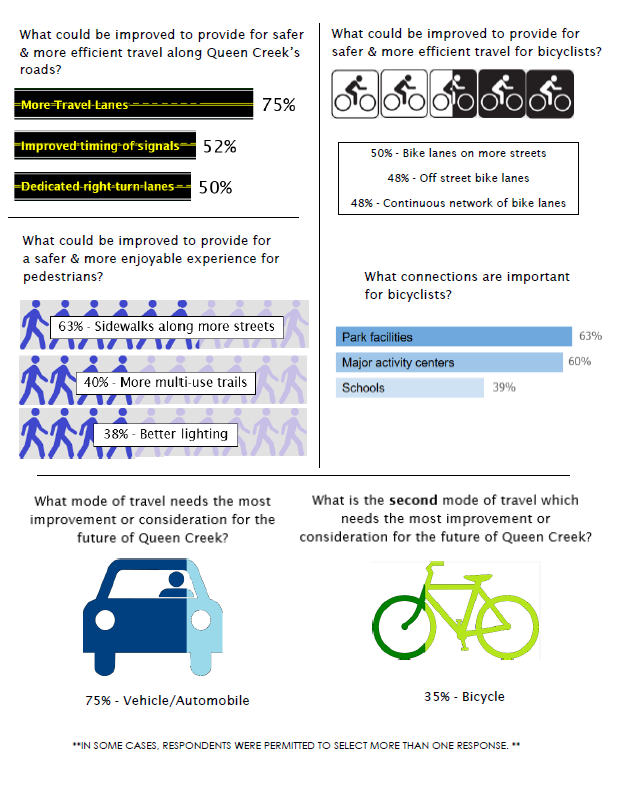
According to the Federal Highway Administration (FHWA), Americans are driving less than they did a decade ago, especially younger adults. However, traffic volume in Queen Creek is increasing. The Town completed a comprehensive Transportation Master Plan, which was incorporated into the General Plan Update.
Queen Creek environmental planning strives to ensure that Queen Creek residents live in a clean, safe and environmentally friendly community. The Town believes in, and supports sustainable development to conserve our most precious resources.
Our current environmental programs include:
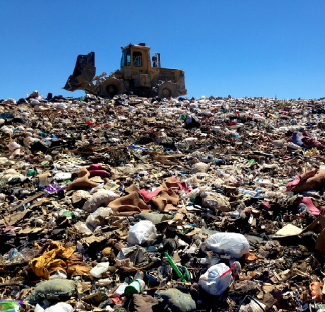
WASTEThe Town has diverted over 8,770 tons of material from the landfill over the past three years through curbside recycling, special events and diversion programs.
GREEN BUILDINGSQueen Creek’s Green Building policy, adopted in 2007, commits the Town to finance, plan, design, construct, manage, renovate and maintain its facilities in accordance with the U.S. Green Building Council’s Leaders.
The Queen Creek Water Department is dedicated to producing drinking water that meets or exceeds all state and federal drinking water standards.
Queen Creek’s current water usage includes:
The 2015 Water Master Plan analyzed growth projections at a 35-year horizon, modeled the impact growth would have on existing water infrastructure, and identified necessary improvements to water infrastructure to service future demands. As a result of that analysis, it was determined that an additional 16 wells, five water storage tanks and associated booster pumps, and 55 miles of distribution water main facilities will be needed to accommodate the future growth.
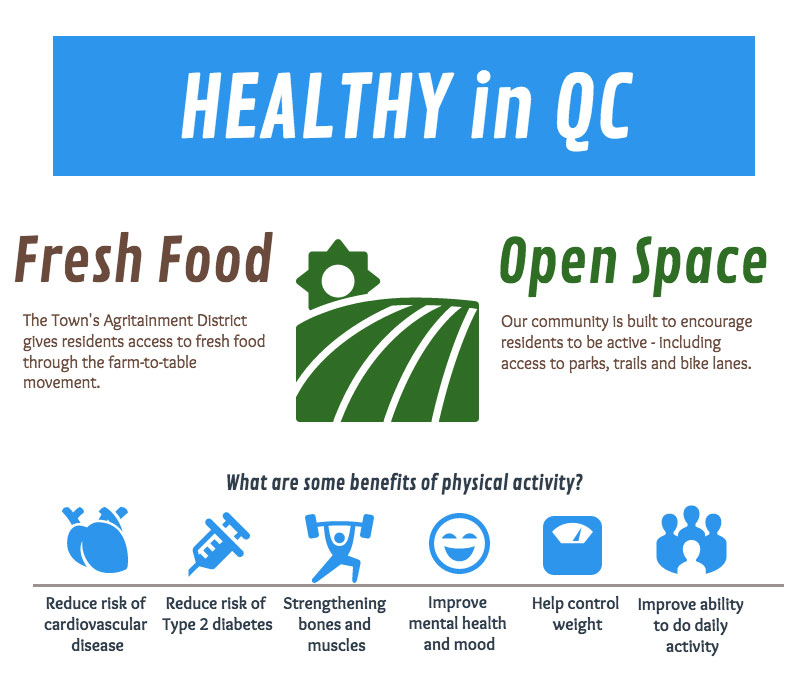
Parks and trails can promote physical activity and community engagement; and provide both environmental and mental health benefits. Parks and trails can improve health through increased physical activity- walkable access to appropriate sites motivates people to participate in physical activity and to do so more frequently. (CDC, 2016) Individual health can be largely impacted by where we live. In addition to clean air and water, places for people to be active, access to quality food, health care, employment opportunities and education are essential to the health of a community. Our built environment plays an important role in our ability to be active, including access to parks, trail systems and bike lanes.
Benefits of Physical Activity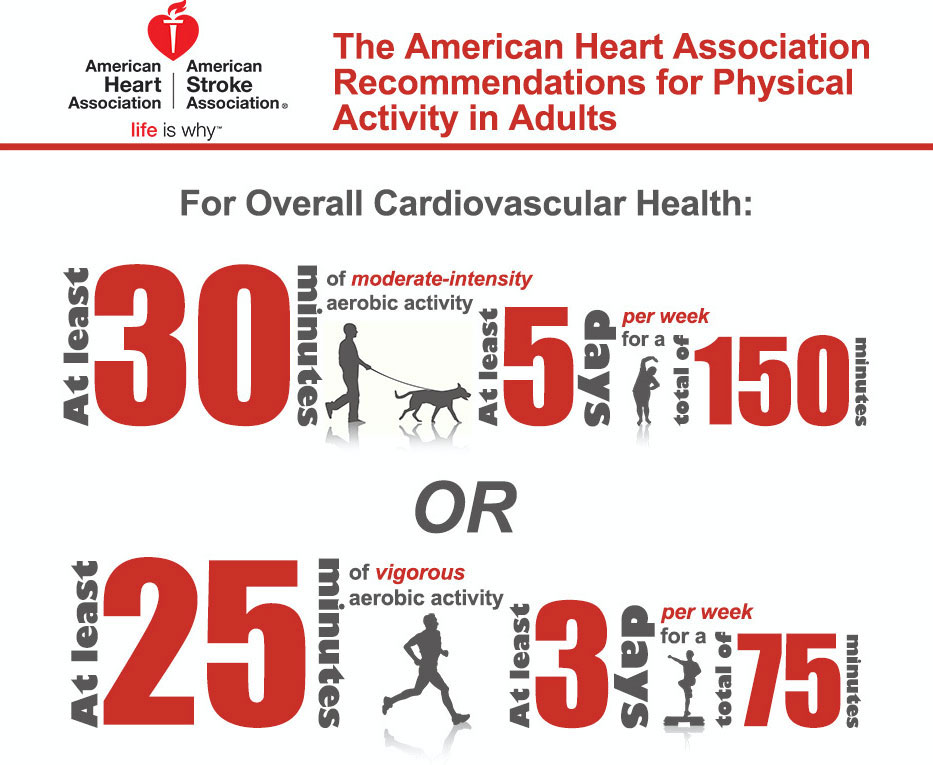
Eating a diet rich in vegetables and fruits as part of an overall healthy diet may reduce risk for type 2 diabetes, lower blood pressure, reduce the risk for heart disease, including heart attack and stroke. (UDSA, 2016)
 USDA, 2016